When to use it
Use canonical visualization tokens and keep the application data model explicit. Provide a concise factual label, and retain the readable native fallback supplied by the component.
Show a distribution with explicit bins, accurate interval widths, and count or density.
Native example
Use canonical visualization tokens and keep the application data model explicit. Provide a concise factual label, and retain the readable native fallback supplied by the component.
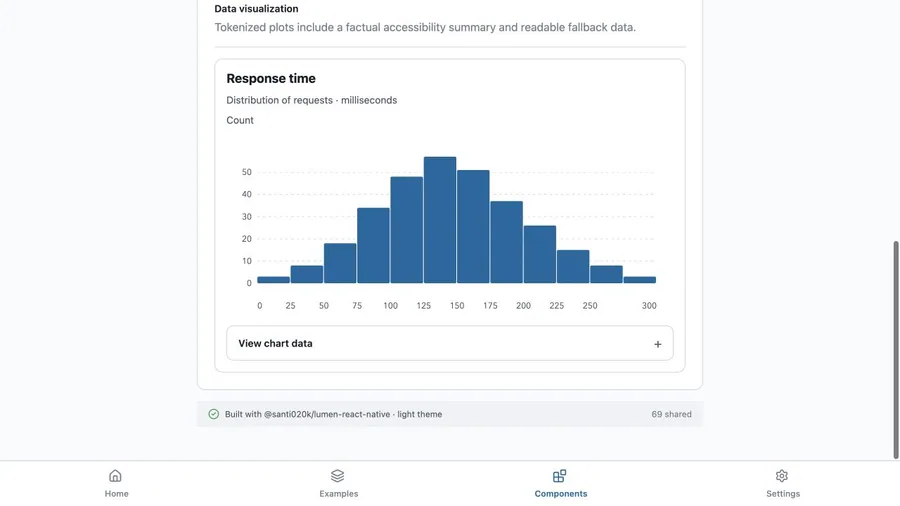
<LumenHistogram
  data={responseTimeBins}
  label="Quarterly revenue"
/>
Reference
The primary shared and platform-specific options exposed by LumenHistogram.
| API | Values or type | Default | Description |
|---|---|---|---|
| label | String | Required | Provides the concise accessible name for the visualization. |
| data | Typed native chart data | Required | Supplies finite values and stable identifiers through the shared chart contract. |
Native behavior
Use canonical visualization tokens and keep the application data model explicit. Provide a concise factual label, and retain the readable native fallback supplied by the component.
Provides labeled axes and expandable bin boundaries, plotted values, and original counts.
Shared component