When to use it
Supply ordered statistics or five null values for a missing summary. Applications own statistical methods.
Shows precomputed quartiles, whiskers and outliers on one numeric scale.
Native example
Supply ordered statistics or five null values for a missing summary. Applications own statistical methods.
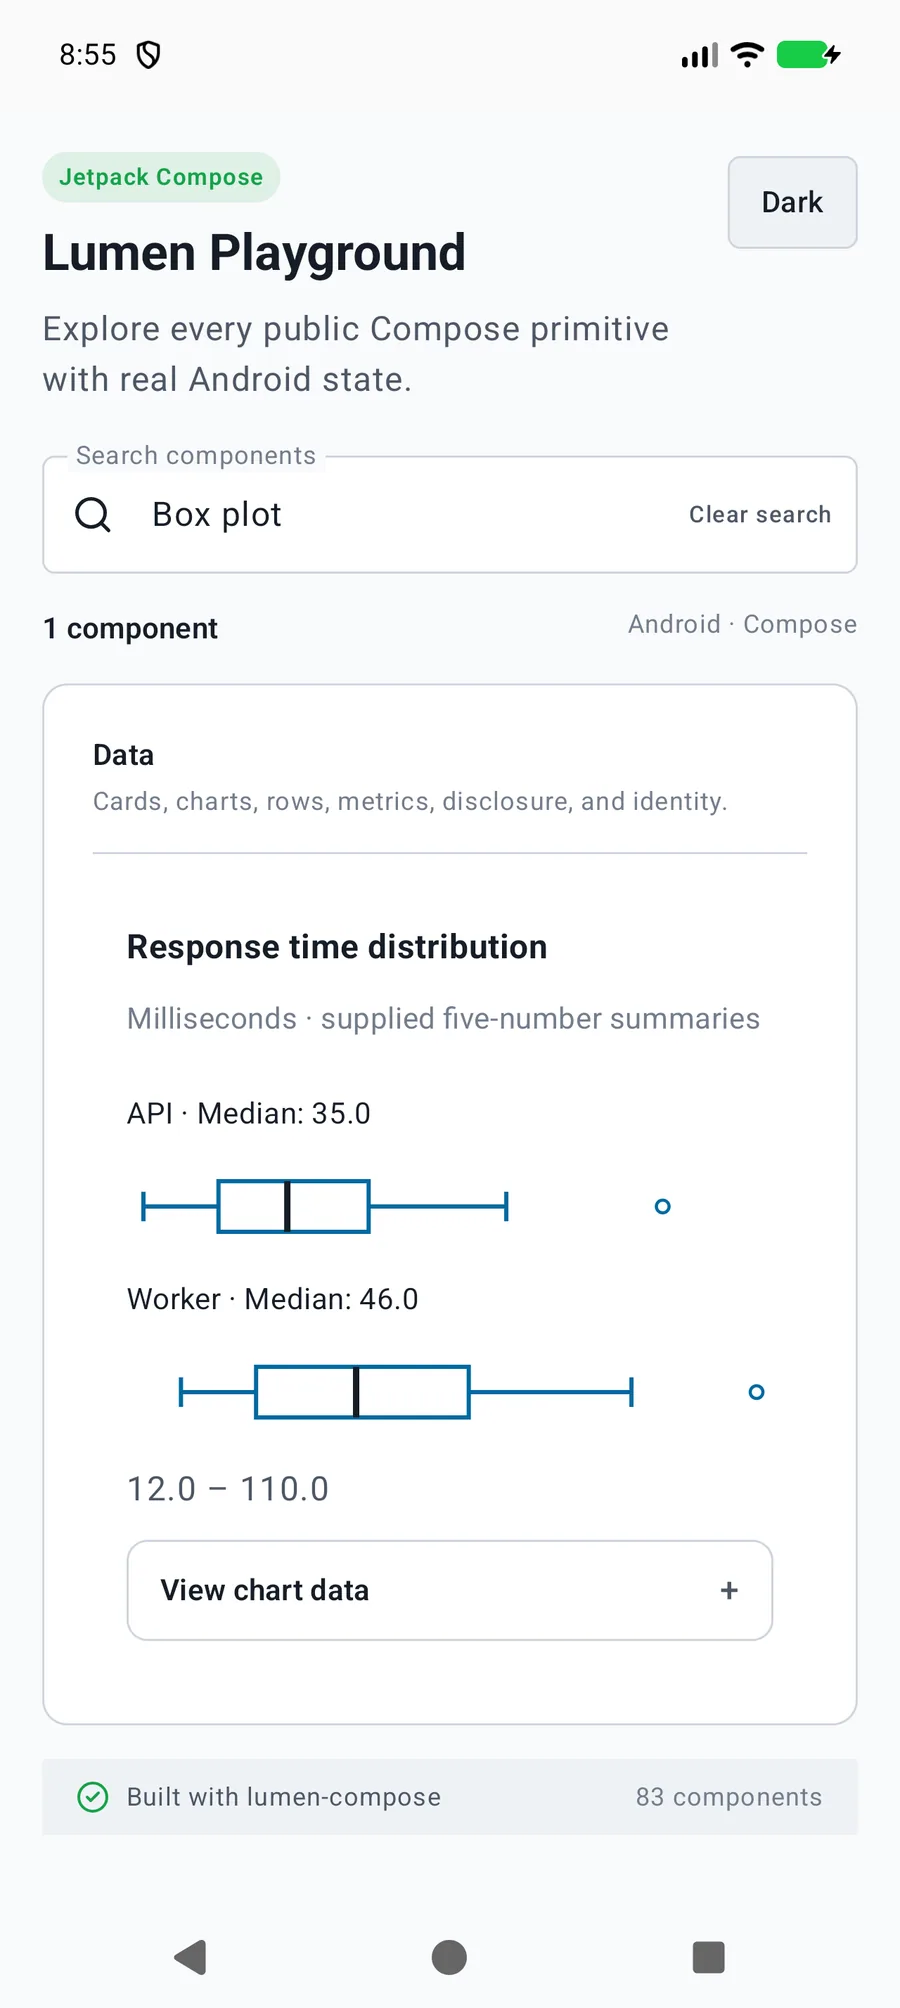
LumenBoxPlot(data = listOf(LumenBoxPlotDatum("north", "North", 12.0, 22.0, 31.0, 44.0, 61.0)), label = "Response distribution")Reference
The primary shared and platform-specific options exposed by LumenBoxPlot.
| API | Values or type | Default | Description |
|---|---|---|---|
| data | LumenBoxPlotDatum[] | Required | Precomputed min/q1/median/q3/max plus optional finite outliers. min/max are whisker bounds. |
| domain | Finite numeric range | Automatic | Encloses every statistic and outlier. |
| statisticLabels, labels | Localized statistic names and formatting | English | Names quartiles, median, whiskers and outliers. |
| showData | Boolean | true | Provides the visible expandable exact statistics. |
Native behavior
Supply ordered statistics or five null values for a missing summary. Applications own statistical methods.
Provides exact statistics with a contrasting median and outlined outliers.
Shared component