When to use it
Supply ordered statistics or five null values for a missing summary. Applications own statistical methods.
Shows precomputed quartiles, whiskers and outliers on one numeric scale.
Apple availability
Import LumenUI in the target that uses this component. iPad support follows the iOS package baseline and uses native iPad layout behavior.
Native example
Supply ordered statistics or five null values for a missing summary. Applications own statistical methods.
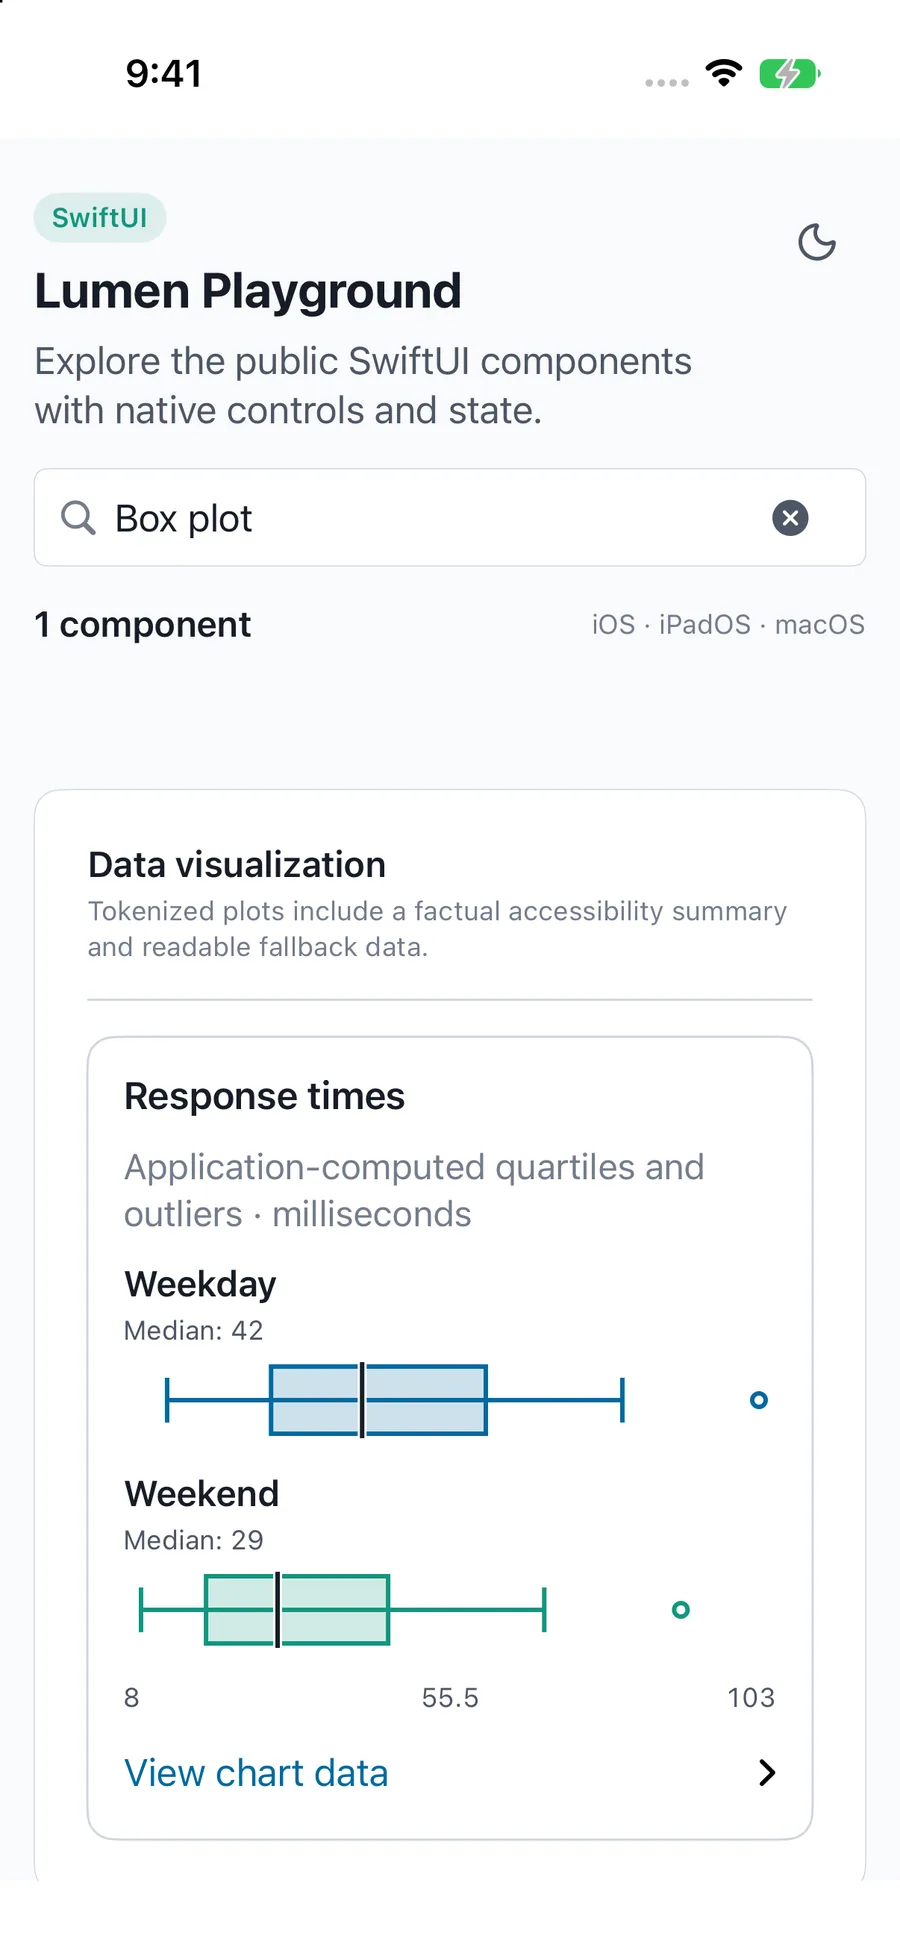
LumenBoxPlot(data: [.init(id: "north", label: "North", min: 12, q1: 22, median: 31, q3: 44, max: 61)], label: "Response distribution")Reference
The primary shared and platform-specific options exposed by LumenBoxPlot.
| API | Values or type | Default | Description |
|---|---|---|---|
| data | LumenBoxPlotDatum[] | Required | Precomputed min/q1/median/q3/max plus optional finite outliers. min/max are whisker bounds. |
| domain | Finite numeric range | Automatic | Encloses every statistic and outlier. |
| statisticLabels, labels | Localized statistic names and formatting | English | Names quartiles, median, whiskers and outliers. |
| showData | Boolean | true | Provides the visible expandable exact statistics. |
Native behavior
Supply ordered statistics or five null values for a missing summary. Applications own statistical methods.
Provides exact statistics with a contrasting median and outlined outliers.
Shared component